Bitcoin Price Prediction: BTC/USD Accelerates Toward $32,000

Bitcoin Price Prediction – July 21
With Bitcoin price shooting close to $32,000 once again, it has done little to flip the market sentiment at this stage
BTC/USD Long-term Trend: Bearish (Daily Chart)
Key levels:
Resistance Levels: $35,000, $37,000, $39,000
Support Levels: $27,000, $25,000, $23,000
According to the daily chart, BTC/USD is correcting gains from $29,501 and it is likely to continue with a new increase as long as there is no close below $30,000. Today, the Bitcoin price saw a steady increase above the $31,000 resistance level as the coin hovers at $31,850. Presently, BTC/USD is settling above the 9-day moving average but it’s yet to conquer the 21-day moving average.
Bitcoin Price Prediction: The Bitcoin Price Blows Hot Again
The Bitcoin price is seen retracing and trading above the 9-day moving average as the coin touches the daily high of $31,960 resistance level with a sign of bullish momentum. However, further increase in the bullish momentum may have to increase the price above this level while another resistance may come at $33,000 before reaching the potential resistance of $35,000, $37,000, and $39,000 levels.
Therefore, if the resistance level of $32,000 failed to hold, it may reverse and face the support level at $30,000 and a further increase in the bears’ pressure may bring the Bitcoin price below the 9-day moving average and possibly cross below the lower boundary of the channel to hit the critical supports at $27,000, $25,000, and $23,000. Meanwhile, the technical indicator Relative Strength Index (14) signal line is moving above 40-level, suggesting a buy signal in the market.
BTC/USD Medium – Term Trend: Bearish (4H Chart)
According to the 4-hour chart, the Bitcoin price is seen trading above the 9-day and 21-day moving averages at $31,883. However, BTC/USD is trying to cross above the upper boundary of the channel to hit the nearest resistance level of $32,500 but any bearish cross below the 9-day and 21-day MAs may bring the coin to the support level of $31,000 and below.
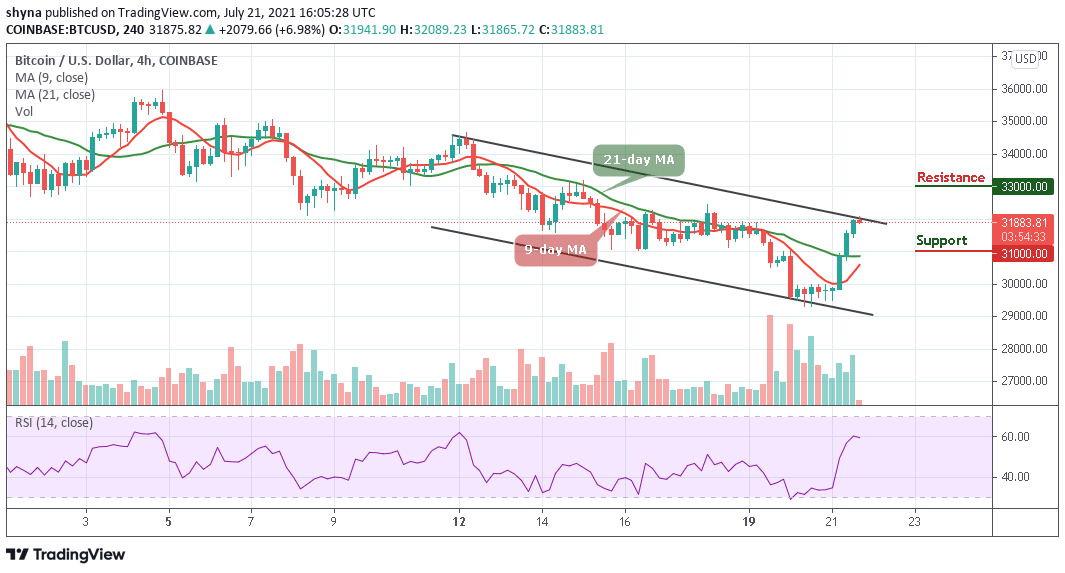
However, if the Bitcoin price finds a decent resistance level around $32,500 level, it may start another bullish movement above the upper boundary of the channel which may likely reach the resistance level of $33,000 and above. In other words, the technical indicator Relative Strength Index (14) is seen moving to cross above 60-level, suggesting additional bullish signals into the market.
Looking to buy or trade Bitcoin (BTC) now? Invest at eToro!
75% of retail investor accounts lose money when trading CFDs with this provider